Week 12: Project Management: CPM & PERT
This week’s big question: a project is a web of tasks that depend on each other. How soon can the whole thing finish, which tasks can’t slip a single day without delaying everyone, and what happens when the task times themselves are uncertain?
Before the week
- Read: Taylor, Introduction to Management Science (13e): Chapter 8, “Project Management,” pp. 380–397 and 400–405 (focus: CPM critical path and slack; PERT three-time estimates; crashing). Skip the Microsoft Project walkthrough on pp. 397–400. Keep Appendix A, “Normal and Chi-Square Tables” open alongside it: the chapter converts a deadline Z value to a probability by reading Table A.1, and so will you. If the normal distribution is rusty, Chapter 11, pp. 553–562, provides the background. Both PDFs are posted in this week’s Canvas module.
- Warm-up self-check, reading a precedence list, slack, and adding times along a path:
Looking ahead: the final exam. The term ends with one cumulative exam in the Dec 14–18 examination period, worth 20 points: 40 questions in 75 minutes, drawn at random from the after-class self-checks and the weekly take-homes across Weeks 1–15. Nothing on it is new. If a week has gone fuzzy, the self-checks for that week are the revision, and Week 16 is a review session built for it.
Session 1: Mon, Nov 9 · Critical path (CPM) (TBD)
🧩 Puzzle
The product launch. You’re shipping a new product, and the work breaks into five project activities (tasks). Some can only start after others finish:
Task Duration (days) Must follow A 3 none B 4 A C 2 A D 5 B, C E 2 D What’s the soonest the launch can finish, and which tasks can’t slip a day without pushing the whole project back? “Just add up the durations” (3+4+2+5+2 = 16) is wrong. B and C run in parallel after A.
Build the network before putting times on it
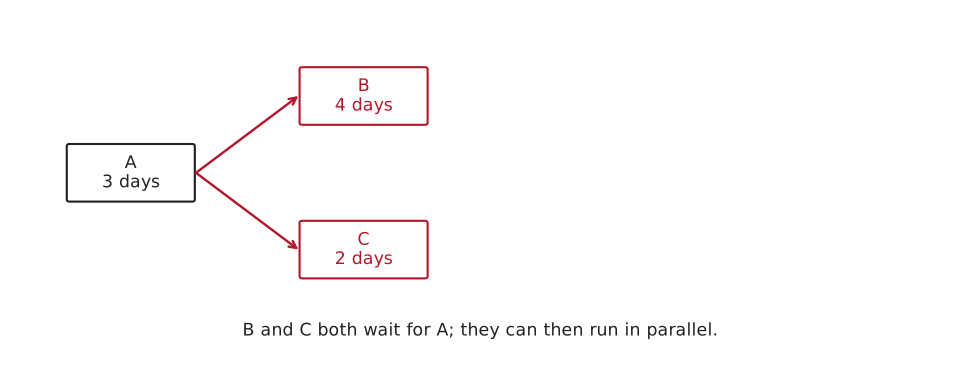
Step 1: place A, then its two immediate successors. B and C both wait for A. Neither waits for the other, so draw separate branches. A node is a task; an arrow means “must finish before.”
Step 2: join both branches at D, then add E. D’s two incoming arrows encode its need for both B and C. E waits for D. The finished network now represents every row of the precedence table.
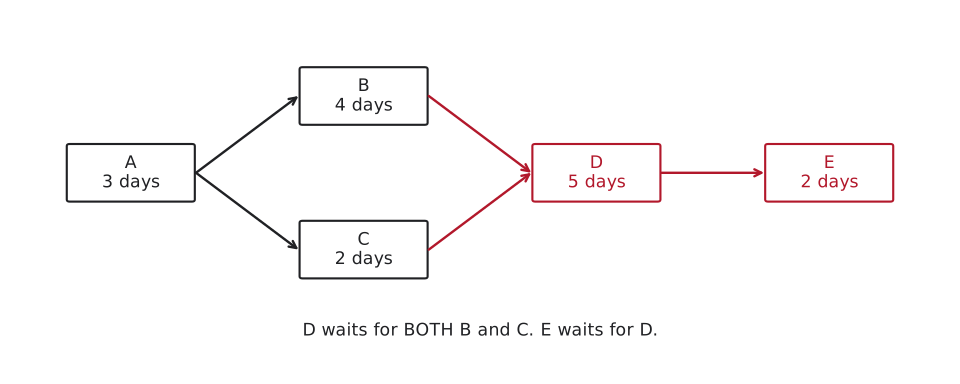
Keep this layout while calculating. Durations belong to tasks, not to the connecting arrows.
Build the skill 1: the forward pass (earliest times)
Draw the tasks as a network: one box per task, and an arrow from A to B means “B can’t start until A is done.” Sketch the launch that way before you read on: A fans out to B and C, both of them feed D, and D feeds E. The forward pass then sweeps left to right to find the earliest each task can happen:
- Earliest start \(ES\) = the latest earliest finish among all of a task’s predecessors (0 if it has none).
- Earliest finish \(EF = ES + \text{duration}\).
A starts at 0 and finishes at 3. B and C both start at 3 (after A), finishing at 7 and 5. D needs both B and C, so it can’t start until the later of the two (day 7) and finishes at 12. E then runs 12→14. The soonest finish is day 14, not 16: C’s two days overlap with part of B.
Here is the network you sketched. Press Forward pass and each box gets its \(ES\) and \(EF\) written above it, the numbers you just worked out, while the readout gives the project’s finish, day 14. The other two buttons belong to Build the skill 2; come back to them there.
Build the skill 2: the backward pass, slack, and the critical path
Start from the finish just found, day 14. E takes 2 days, so its latest start is day 12. D must finish by that day and takes 5, so its latest start is day 7. Both B and C feed D: B therefore runs no later than days 3–7, while C can run as late as days 5–7.
Now work backward through A’s split. B needs A finished by day 3; C needs it by day 5. A must satisfy both, so use the earlier deadline, day 3. That is why the backward pass takes a minimum, whereas D’s forward pass took the maximum of its predecessors’ finishes.
In the figure, ES/EF mean earliest start/finish and LS/LF mean latest start/finish, all in days from the project start.
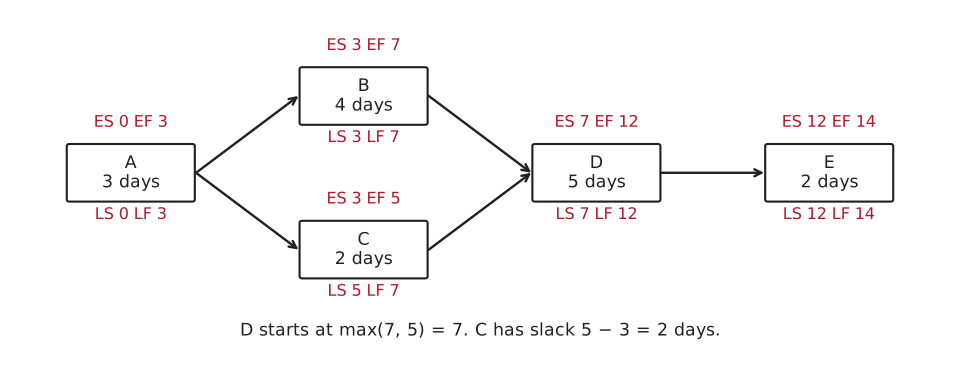
The backward pass sweeps right to left to find the latest each task can happen without delaying the finish:
- Latest finish \(LF\) = the earliest latest start among all of a task’s successors (the project finish, 14, for the last task).
- Latest start \(LS = LF - \text{duration}\).
Then for every task, slack \(= LS - ES\) = how many days it could slip with no effect on the finish. The critical path is the chain of zero-slack tasks: slip any of them and the whole project slips.
| Task | \(ES\) | \(EF\) | \(LS\) | \(LF\) | Slack | Critical? |
|---|---|---|---|---|---|---|
| A | 0 | 3 | 0 | 3 | 0 | yes |
| B | 3 | 7 | 3 | 7 | 0 | yes |
| C | 3 | 5 | 5 | 7 | 2 | no |
| D | 7 | 12 | 7 | 12 | 0 | yes |
| E | 12 | 14 | 12 | 14 | 0 | yes |
The critical path is A → B → D → E, length 14 days. Only C has slack (2 days): it could start as late as day 5 and still finish before D needs it. Now press Backward pass on the network above: each box gets its \(LS\) and \(LF\) written below it, the same numbers as the table’s \(LS\) and \(LF\) columns. Then Critical path lights up A, B, D and E, the four tasks with zero slack.
Here is the small paradox worth pausing on. The critical path is the longest path through the network (A→B→D→E = 3+4+5+2 = 14 beats the other route A→C→D→E = 3+2+5+2 = 12). Yet that longest path is also the shortest possible time in which the whole project can finish. You simply cannot beat your slowest chain of dependencies, because every task on it must wait for the one before. “Longest path = minimum project duration” is the headline definition of the critical path, and the rest of the week hangs off it. One more nuance: slack can be shared. The route A→C→D→E has 2 days to spare (12 days against 14), and C is its only task off the critical path, so here both days are C’s. If that branch held two tasks in a row, say C split into a 1-day design review and a 1-day sign-off, the pair would share the 2 days: spend them on the first and the second has none left.
How we draw it: AON networks, Gantt charts, and the dummy activity
The box-per-task picture above is an activity-on-node (AON) network: each task is a node (a box) and each arrow is just a precedence link. Taylor also shows the older activity-on-arrow (AOA) style, where the arrow is the task and the nodes are milestone events. The two carry the same information, and Taylor, like Microsoft Project, works mostly in AON, so we do too. Only AOA ever needs a dummy activity: a zero-time arrow that carries no work and exists only to show a precedence relationship. AON never needs one, which is another reason to prefer it.
A different picture you have probably seen is a Gantt chart, developed by Henry Gantt in 1914: one horizontal bar per task, laid out against the calendar. A Gantt chart of the launch draws A over days 0–3, B over 3–7, C over 3–5, D over 7–12 and E over 12–14, and C’s 2 days of slack show as the gap between the end of its bar and day 7, when D starts. That makes a Gantt chart good for seeing when each task runs and how the tasks overlap. What the bars do not make obvious is that D is waiting for both B and C: Taylor’s caution is that a Gantt chart’s precedence relationships are not always easy to see, which limits it to smaller projects. A project network makes the dependencies explicit, which is what we need to answer “what can’t slip?”
Build the skill 3: buy time by crashing the critical path
Suppose your boss wants the launch sooner than day 14 and asks what each day would cost. Crashing means paying to shorten a task: overtime, an extra contractor, expedited parts. The rule is blunt: to move the finish date, shorten every path currently setting that date. With one critical path, start with a task on it. Speeding up C does nothing, because C already has 2 days of slack.
Two of the launch’s tasks can be crashed: B from 4 days to 2 for an extra \$600, and D from 5 days to 4 for an extra \$1,200. A, C and E take their normal times whatever you pay. The two quotes buy different numbers of days, so compare them per day with the textbook’s crash cost per day = (crash cost − normal cost) / (normal time − crash time), where crash cost minus normal cost is the extra you were quoted. B costs \$600 / 2 = \$300 per day saved and D costs \$1,200 per day saved, so buy B’s days first, and check both paths (their lengths in days) after every day you buy:
| Day bought | Crash | Cost of the day | A→B→D→E | A→C→D→E | Launch finishes |
|---|---|---|---|---|---|
| 1st | B: 4→3 | \$300 | 13 | 12 | day 13 |
| 2nd | B: 3→2 | \$300 | 12 | 12 | day 12 |
| 3rd | D: 5→4 | \$1,200 | 11 | 11 | day 11 |
The first B day takes the launch to 13 days, and C’s slack drops from 2 to 1: B sits only on the top path, so the C path catches up by a day. The second B day brings both paths to 12 and C’s slack to zero, so C is now co-critical. From here a day has to shorten both paths at once, and even a third B day, if B had one to sell, would buy nothing: the C path would hold the finish at 12. The tasks the two paths share are A, D and E, and of those only D can be crashed, so the third day costs \$1,200, four times each of the first two. With B and D used up, 11 days for \$1,800 in all is as fast as the launch can go. That is the lesson the take-home grades on: crash the cheapest critical task first, count how many days it can buy before a second path catches up (here the C path’s 2 days of slack), and expect the price of a day to jump once it does.
In practice: the critical path is a snapshot, not a guarantee
- Estimates run optimistic. People quote durations they’d hit on a good day. A network built on rosy numbers gives a rosy finish date: pad with care, not panic.
- The critical path can move. C has only 2 days of slack. If C runs 3 days late, the C path takes 15 days: the launch slips to day 15, and B, not C, is now the task with slack. Watch near-critical tasks, not just the zero-slack ones, and remember crashing creates near-critical tasks, as the table above showed.
- Crashing trades money for time, with diminishing returns. The first day you buy is on the cheapest critical task; later days get pricier because more paths go critical at once (the launch’s third day costs four times its first), so there is a point past which shaving another day costs more than the delay is worth.
Back to the puzzle
The launch finishes in 14 days, not 16. The tasks that can’t slip a day are A, B, D, and E (the critical path); C is the only one with breathing room (2 days). If your boss wants it sooner, the cheapest days are B’s two at \$300 each, which bring the launch to 12 days; a third day costs \$1,200 on D, because by then the C path is critical too, and 11 days is as fast as the quotes allow.
In-class group practice (wrap-up)
To close Session 1, work a small project network by hand in your group: forward pass, backward pass, slack, and the critical path. The scenario is a campus food-truck pop-up (six tasks, two branches that converge, exactly one branch with slack), so it is a fresh forward/backward-pass rep, not the launch over again.
Write every member’s name on the sheet. You have 15 minutes for the practice, then two minutes to photograph your group’s own attempt before the solutions are shown. One member uploads the photo to Canvas by the end of class; participation credit is for attempting the work.
The instructor uses the final eight minutes to demonstrate the handout’s method, check the main results with units, and explain a common mistake. This demonstration closes the session.
- Download: Week 12 group practice (Word)
Session 2: Wed, Nov 11 · PERT (uncertain durations) (TBD)
🧩 Puzzle
Real task times aren’t known up front. Task D (“integration testing”) might take 3 days if everything goes smoothly, 7 if it goes badly, most likely 5. The launch is promised to a customer by day 16. With durations this uncertain, how confident can you be that you’ll actually make the deadline?
Build the skill 1: three-point estimates and expected time
PERT replaces each single duration with three estimates: optimistic \(o\), most likely \(m\), and pessimistic \(p\) (Taylor writes these \(a\), \(m\), \(b\)). From them it computes an expected time and a variance for each task:
\[t_e = \frac{o + 4m + p}{6}, \qquad \sigma^2 = \left(\frac{p - o}{6}\right)^2 .\]Here tₑ, σ² name the activity’s expected duration and variance.
For D, put the three estimates on one scale: optimistic 3 days, most likely 5, pessimistic 7. The PERT mean gives the middle estimate four shares and each extreme one: \([3+4(5)+7]/6=5\) days. The spread is \(7-3=4\) days; the conventional standard-deviation estimate is \(4/6\approx0.667\) days, and squaring gives variance \(0.444\) days squared.
These are PERT’s approximations for a bounded, potentially skewed activity-time distribution, commonly modeled with a beta distribution. The weights and range-divided-by-six rule are estimation conventions; three judgments do not determine an exact distribution. Use them consistently, then keep that limitation attached to the deadline probability.
Estimating our launch’s critical-path tasks three ways gives expected times that reproduce the Session-1 durations:
| Task | \(o\) | \(m\) | \(p\) | \(t_e = (o+4m+p)/6\) | \(\sigma^2 = ((p-o)/6)^2\) |
|---|---|---|---|---|---|
| A | 2 | 3 | 4 | 3 | \(((4-2)/6)^2 = 0.111\) |
| B | 2 | 4 | 6 | 4 | \(((6-2)/6)^2 = 0.444\) |
| D | 3 | 5 | 7 | 5 | \(((7-3)/6)^2 = 0.444\) |
| E | 1 | 2 | 3 | 2 | \(((3-1)/6)^2 = 0.111\) |
Each \(t_e\) matches Monday’s duration, and C keeps its 2 days, so the two passes run exactly as they did on Monday. Press the three buttons and the launch again finishes at day 14 with A → B → D → E critical: that is the path whose times and variances Build the skill 2 adds up.
Build the skill 2: project length, variance, and “P(finish by the deadline)”
The basic PERT approximation follows the path that is critical at the expected task times: A → B → D → E. Add its expected times for a path mean, and, assuming independent task times, add its variances. This approximates the project finish while keeping that path fixed:
\[\Sigma t_e = 3 + 4 + 5 + 2 = 14 \text{ days}, \qquad \Sigma \sigma^2 = 0.111 + 0.444 + 0.444 + 0.111 = 1.11,\]so the standard deviation is \(\sigma = \sqrt{1.11} \approx 1.05\) days. Why are we allowed to treat the project length as a normal bell curve at all? The Central Limit Theorem: a sum of several independent task times tends toward a normal distribution, even when the individual tasks are skewed. Four tasks do not guarantee a normal total; here we use it as the textbook approximation and report the resulting probability as an estimate. To find the chance of finishing by a deadline, standardize with a normal z-score:
For the day-16 promise: \(z = (16 - 14)/1.05 \approx 1.90\). From a standard-normal table, \(P(Z \le 1.90) \approx 0.97\), about a 97% chance of finishing on or before day 16 under this approximation. (For a 50/50 deadline you’d quote day 14, the mean; pushing the promise to day 16 buys a comfortable cushion.)
Read Appendix A’s table carefully. Taylor’s Table A.1 gives the area between 0 and a positive z, not the whole probability to the left. At \(z=1.90\), row 1.9 and column .00 give 0.4713. Add the left half of the bell: \(0.5000+0.4713=0.9713\). A calculator that reports the cumulative normal probability gives 0.9713 directly. Both describe the same shaded area, completion by day 16.
The answer is not always “about 97%,” and a tighter deadline makes that obvious. Suppose a competitor will poach the client if the launch isn’t live by day 13. Now the deadline is below the mean, so the \(z\)-score goes negative: \(z = (13 - 14)/1.05 \approx -0.95\), and \(P(Z \le -0.95) \approx 0.17\), only about a 17% chance. Same project, same variance, but a promise you would miss five times out of six. The three deadlines line up cleanly: day 13 → 17%, day 14 → 50%, day 16 → 97%. PERT does not bless every promise; it tells you which ones are safe and which are wishful.
For the negative score, Table A.1 gives 0.3289 between 0 and 0.95. Subtract from the left half: \(0.5000-0.3289=0.1711\). A deadline before the mean leaves less than half the bell to its left.
In practice: PERT’s confidence is softer than it looks
- The \(t_e = (o + 4m + p)/6\) weighting is a beta approximation, not a law. It is a reasonable rule of thumb that comes from the beta-distribution model above. Treat the resulting numbers as informed estimates, not measurements.
- Two big assumptions hide in that 0.97. PERT sums variances as if tasks are independent (one slip often makes the next slip too) and treats the total as normal. The Central Limit Theorem makes normality reasonable on a long critical path, but on a small project with only a few critical tasks it has not fully “kicked in,” so the probability is indicative, not exact.
- Only the critical path is counted. A near-critical path can make you late even when the critical path behaves. Here that is the C branch, A → C → D → E: it shares A, D and E with the critical path, so it takes over whenever C runs longer than B, and the 0.97 never looks at C at all. A path that’s “almost critical” with high variance deserves a look.
Back to the puzzle
The launch’s expected length is 14 days with \(\sigma \approx 1.05\), so the day-16 promise has about a 97% estimated chance of being met under the fixed-path, independence, and normal approximations. Check those assumptions before promising the date. If the customer wanted day 14, you’d be at only 50%; if they demanded day 13, you’d be down near 17%, so you’d either crash a critical task or negotiate, because the math says you’d miss far more often than not.
After-class check
Questions spanning the forward and backward pass, slack, the critical path, crashing, and PERT expected time, variance, and deadline probability. Retry freely; nothing is submitted.
Weekly take-home (graded: submit on Canvas)
This week’s take-home is a CPM and PERT model for a county elections office that needs a date it can defend to its commission. The dependencies are stated only in the narrative (the ballots cannot go to print until the candidate list is certified, and so on) so your first job in the Your model block is to turn that prose into a precedence table, converting the one duration quoted in weeks. Then you run both passes to get the project duration, the critical path and the slack; use three-point estimates to work out the probability of meeting the commission’s deadline; and turn the crash quotes into a cost per day to find the cheapest place to buy time, and how few days of it are worth buying before a second path catches up. Two short responses plus the required AI-use disclosure go on the Free responses sheet. Upload the completed .xlsx on Canvas. That one file is your entire submission.