Week 16: Review & Course Close
This week’s big question: every problem so far arrived with a chapter attached. Real ones don’t. When a messy situation lands on your desk with no label, how do you pick the method, check that it worked, and hand back a recommendation somebody can act on?
This is the last week of class and it carries no new chapter and no take-home. Both sessions are review for the final exam, which reaches Weeks 1 through 15. Monday closes with a group practice worth 1 point, the fifteenth and last; Wednesday closes the course.
The final is in the Dec 14–18 examination period. Our last class meeting is Wed Dec 9. The exam is cumulative, 40 questions in 75 minutes, drawn at random from the after-class self-checks and the weekly take-homes. The registrar sets the exact day and time; it will be posted here and on Canvas. See Exams.
Before the week
- Read: no new chapter. Skim your notes, solved workbooks, and the Key Concepts from Weeks 1–15.
- Revise for the final. Work back through the after-class self-checks for every week, and reread the take-homes you built. That is the exam’s question pool, so it is the whole revision list.
- Work through the recap reference below on your own. It is here to read at your own pace; the sessions are given over to review and questions.
- Cumulative warm-up: use this ungraded check to identify the topics that need another look.
Recap reference: choose, solve, and check
Self-study. Monday opens with a ten-minute warm-up drawn from the puzzle below, but the rest is here for you to work through whenever you like. None of it is new material.
🧩 Puzzle
The director’s desk. A director drops by: “Our delivery program costs too much, demand swings every month, and some sites keep running short. What should we do?” No table, no numbers, no chapter number. Which question do you sharpen first, which method answers it, and what evidence would make your recommendation credible?
The director has combined three questions: how much demand to expect, how to serve it, and whether the result is affordable. Separate them before calculating. A forecast supplies a demand estimate; a routing model uses that estimate to choose shipments; a sensitivity check asks whether that choice survives a plausible change. Each model’s output becomes the next decision’s input.
Build the skill 1: run the five-step cycle you have used all term
Every topic in this course has been the same cycle wearing different clothes. Here it is on the director’s program:
- Observe the system. Name the symptom, the decision-maker, and who else is affected: rising delivery costs and sites that run short, the director who has to choose, and the partner agencies whose clients wait on the deliveries.
- Define the problem. Turn “costs are too high” into something you could actually answer: “Which routing plan meets every site’s demand at minimum monthly cost?”
- Construct the model. Name the choices, the objective, the limits, and where the input data comes from, such as last year’s delivery logs and the van’s lease.
- Solve and check it. Compute it, verify it, and move at least one plausible input, such as the cost of fuel, to see what happens.
- Recommend and implement. Say what to do, then say what would change your mind.
Steps 2 and 5 are the ones students skip, and they are exactly the two that keep correct arithmetic from answering the wrong question.
Build the skill 2: listen for the structure, not the vocabulary
| Signal in the problem | Method to revisit | Course week |
|---|---|---|
| Find the volume where revenue first covers fixed and variable cost | Break-even analysis | W1 |
| Weigh one uncertain quantity, or combine probabilities from raw data | Probability rules and expected value | W2 |
| Choose among alternatives when outcomes or information are uncertain | Decision analysis, trees, EVPI/EVSI | W3–W6 |
| Allocate limited resources to maximize or minimize one objective | Linear programming, and its sensitivity report | W7–W9 |
| Ship from sources to destinations or assign people to tasks | Transportation or assignment | W10 |
| Balance several competing targets or criteria | Goal programming or multi-criteria analysis | W11 |
| Schedule activities that depend on one another and identify delay risk | CPM/PERT | W12 |
| Predict a future value from past values or a related predictor | Forecasting or regression | W13 and W15 |
A signal gives you a candidate, not an answer. Before you commit, check that the data and the assumptions actually fit, starting with whether the quantities you need are known (deterministic) or uncertain (probabilistic). An LP treats its inputs as fixed; a payoff table can compare choices across uncertain states. The director’s van lease is known to the dollar; next year’s demand is not, which is why the next skill is a decision tree rather than an LP.
Build the skill 3: fold back a decision one more time
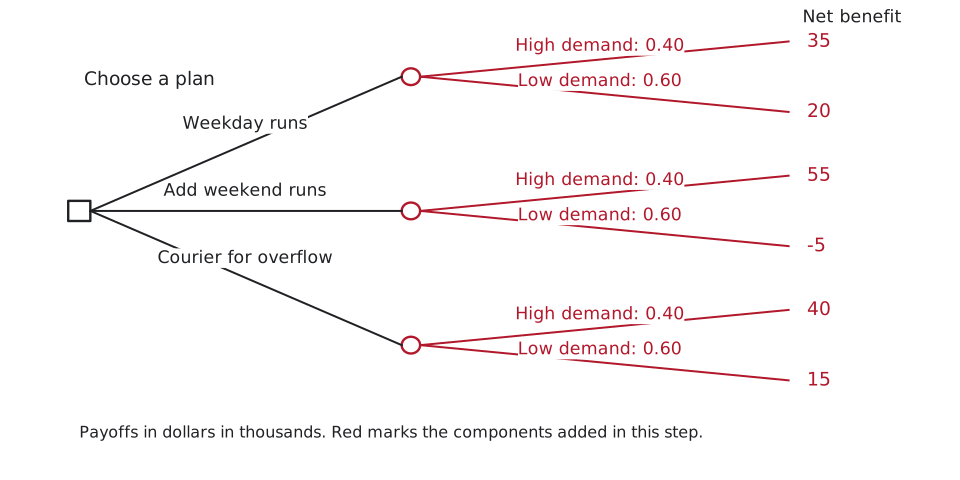
The director has to commit to a capacity plan for next year before knowing whether demand will run high (\(0.40\)) or low (\(0.60\)). The program can keep its van on weekday runs as it is now, add weekend runs (overtime for the driver, committed for the whole year), or keep a courier for overflow on call (a monthly retainer, then a premium on each delivery the van cannot fit). Payoffs are the program’s net benefit over the year in \$ thousands, so 35 means \$35,000.
Keep the alternatives and their possible outcomes visible before calculating an average:
| Annual net benefit (dollars in thousands) | High demand, probability 0.40 | Low demand, probability 0.60 |
|---|---|---|
| Weekday runs | 35 | 20 |
| Add weekend runs | 55 | −5 |
| Courier for overflow | 40 | 15 |
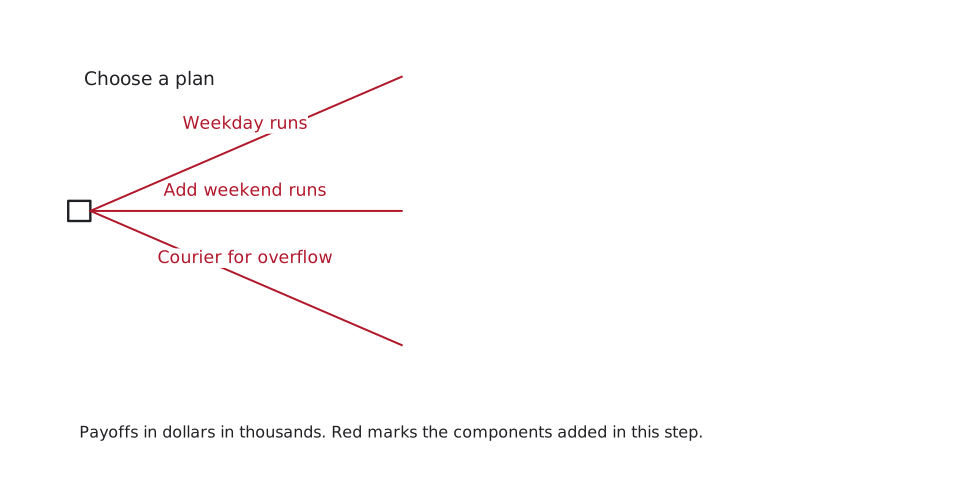
1. Draw the decision first. The square has one branch for each commitment. New branches are red.
2. Add what happens after each choice. Each chance circle gets High and Low demand branches, their probabilities, and that plan’s payoffs. The decision branches stay in place.
Now fold the completed tree. At each circle, weight the payoffs by their probabilities and add. At the square, keep the largest of those averages:
- Weekday runs: \(0.40(35) + 0.60(20) = 14 + 12 = 26\)
- Add weekend runs: \(0.40(55) + 0.60(-5) = 22 - 3 = 19\)
- Courier for overflow: \(0.40(40) + 0.60(15) = 16 + 9 = 25\)
Weekday runs win on expected value at \$26 thousand, \$1,000 ahead of the courier. But finishing there is the mistake. Where did the \(0.40\) come from? At \(0.50\) the courier ties weekday runs, at \$27.5 thousand each. And does net benefit count the sites that go short in a high-demand year? Under weekday runs those are the very sites the director came in about. The arithmetic took ten seconds. Those two questions are the job.
Press Fold back on the tree below and watch the three circles take 26, 19 and 25 before the square keeps weekday runs. To rehearse the fold yourself, build the same tree in the tree builder, fold it back on paper, and let its Check tab mark your values.
Build the skill 4: check whether deliveries cover the lease
The director’s first complaint was cost, so find how many deliveries cover the van’s cost. The program leases its delivery van for \$1,800 a month, spends \$7 per delivery in fuel and time, and the partner agencies reimburse \$25 per delivery. The contribution margin is \(25 - 7 = 18\) dollars per delivery, so
\[q^* = \frac{1{,}800}{25 - 7} = 100 \text{ deliveries a month}.\]One hundred deliveries a month. That break-even volume is a threshold to compare against the requests the partner agencies actually send, not a promise that they will send them. In a slow month of 80 deliveries the van falls \(1{,}800 - 80(18) = \$360\) short of its lease. And if fuel adds \$2 to every delivery, the margin drops to \$16 and break-even rises to \(1{,}800 / 16 = 112.5\), so 113 deliveries a month. Move the sliders and watch the threshold shift: the price slider is the \$25 reimbursement, and setting the variable cost to 9 is that fuel rise.
Try the selection before looking at the method name
For each question, identify what is chosen, what is unknown, and which check could overturn the answer. These are parts of the director’s same delivery program.
| Question | Structure to recognize | Method and first check |
|---|---|---|
| How many deliveries will sites request next month? | Unknown future demand, with monthly history | Forecast; compare past forecast errors on the same months |
| Which depot should supply each site’s stated demand? | Shipment quantities, source limits, destination needs | Transportation; check supply and demand in the same units |
| Which annual capacity plan should we commit to before demand is known? | Discrete choices followed by uncertain outcomes | Decision tree; check probabilities and whether all relevant consequences enter the payoffs |
| How many deliveries cover the monthly lease? | Fixed cost and margin per delivery | Break-even; check that reimbursement exceeds variable cost |
The word “delivery” fits all four rows. The structure of the question is what selects the method.
In practice: your method choice is a claim you have to defend
- Start with the decision, not the software. “I used Excel” names no method and explains nothing. “I used a transportation model because every site’s demand had to be met from a fixed set of depots” does both.
- Separate predicting from choosing. A forecast estimates what will happen; an optimization or decision model recommends what to do about it. Confusing the two is how you end up optimizing a guess.
- Find the assumption the answer rests on. Probabilities, linear relationships, stable trends and task durations are all estimates. Move the one that matters most and see whether your recommendation survives; in this recap, those are the 0.40 and the \$7 a delivery.
- Two models beat one when the question has two halves. Forecast the demand first, then route supplies for it. That is not overkill; that is the director’s question answered properly.
Back to the puzzle
The director asked three questions in one breath, and each points somewhere different: “what will demand be?” is forecasting, “how should we route deliveries?” is transportation, and “does this still hold if fuel goes up?” is a sensitivity check. So pick one decision, name the method whose structure matches it, solve it, and report two things: the action, and the conditions under which the action stops being right. This recap has done that twice for the program. The van pays its own lease past 100 deliveries a month, or 113 if fuel adds \$2 a delivery. Weekday runs are next year’s best plan on expected net benefit, but only while high demand stays less likely than 0.50, and only if nobody counts the sites that go short in a busy year.
Session 1: Mon, Dec 7 · Choosing the method, and open review (TBD)
We work the director’s-desk puzzle above together, then open the floor: bring the weeks you want re-explained and we do them on the projector. Come with specific questions rather than “can you review Week 10” and the session is worth far more to you.
In-class group practice (wrap-up)
The last of the fifteen group practices, and the only one that is not about a single chapter. Your group gets four short situations with no chapter numbers attached. For each one: sharpen the question, name the method whose structure matches it, and say what evidence would make the recommendation credible. It earns 1 participation point, exactly like every other week.
This is deliberately the skill the rest of the course cannot drill, because every other week arrives already labelled. It is also good final revision: naming which method a situation calls for is most of what the exam’s interpretation questions ask.
Write every member’s name on the sheet. You have 15 minutes for the practice, then two minutes to photograph your group’s own attempt before the solutions are shown. One member uploads the photo to Canvas by the end of class; participation credit is for attempting the work.
The instructor uses the final eight minutes to demonstrate the handout’s method, check the main results with units, and explain a common mistake. This demonstration closes the session.
- Download: Week 16 group practice (Word)
Session 2: Wed, Dec 9 · Course close and exam review (TBD)
The last meeting. We take a cumulative look back across the methods, walk the format of the final so nobody meets it cold, work whatever the cumulative self-check below turned up as the common soft spots, and do the course evaluation. Bring exam questions while we are all still in the room.
Cumulative self-check
One last ungraded check across the term’s methods and interpretations. Retry it freely, and treat anything you miss as your revision list for the final.